Module 8, Introduction to Microsoft Project
Example
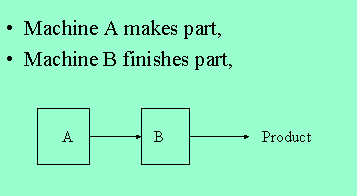
Consider an assembly line that makes finished parts. It has machines A and B.
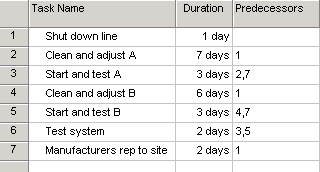
When the plant has its annual turnaround it must: shut the line down, do maintenance on both machines, test each machine, then restart the line. For each machine there are two tasks, Clean and adjust, and start and test. One more activity, the manufacture of the the machines requires a representative on site before the machines are restarted.
Here I suggest you use some MS Project 2013 Tutorials. Open Project 2013, and click on the question mark in the top upper right. Then search for "tutorial." You'll see four "beginer" tutorials, described as "webinars." You should look at "Getting Started with Project." That will indeed get you started. Rember where you were, since the other three tutorials will be helpful. When you come back after the tutorial, download this file to your desktop then open it with MS Project. It has the machine cleaning project.
It might be too crowded to keep the MS Project open and this web page. When MS Project opens the file, you'll recognize the tasks, duration and precedents from the tables above. The VIEW, TABLE: is set to "Entry" and the Chart type is "Gantt Chart" you can set the chart type from the panel to the left, where you see the button depressed, or from the VIEW menu, where it is a check box. Now the start date is set for 3 December. Go ahead and change it to today's date. Just click on the date, hit the dropdown menu, and click on any date in the workweek. Observe the other dates change. The diagram to the right might be lost, so hit "zoom" and then "entire project" and the time scale will move over to show the project. Click on the tab Gantt Chart Tools and Format. Then click on the Critical Tasks and Slack. See how the criticl path is shown in red and a bar indicates slack.
Now click on the "View" tab again on the left, click on the "Network Diagram" Observe that the tasks are in blocks, these are called "nodes" and the chart type is called "activity on node" CPM. The critical path is indicated in red.
Click back on the Gantt Chart button on the left, and resize and/or scroll to the right and observe the chart. The arrows indicate the precedence.
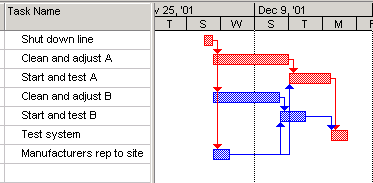
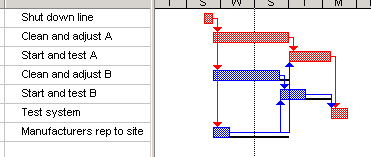
Now look at the Manufacturers Representative. It appears above that he will get to the site and sit around for a few day. He might. Actually, there is slack in this activity. Here I played with the Gantt chart wizard (custom chart) to show the slack in activities with a black line.
Note you have done this all with one Table View: Entry. Now leave it in Gantt chart view and go to the VIEW tab above, then click on Table then change from "Entry" to "Schedule" with that you will have to resize the table view and you will see the far right columns which say "Free Slack" and "Total Slack." Free slack is the amount you can delay that task without delaying the next task that depends on it. Total Slack is how much you can delay that task without delaying the project.
Those two tables: entry and schedule, and the two charts: Gantt and Network, will get you started on most assignments. Note you can play with time scale to make it more pertinent. Also, be careful resizing columns. If you size a column to the end it will disappear. The data in the column is still there, but you can't see it. If you do that by mistake, you have to add the column back by using INSERT button, then Column, then search the dropdown menu for the name of the column you hid.
End of Module 8