Animal Testing for Carcinogens.
In earlier submodules you learned that epidemiology asks the right question, but most often can't answer it. Knowing that cancer involves mutations in cell's genetic material, we learned there are in vitro tests for genotoxic chemicals, in fact many tests. They often give useful information about the chemical's ability to cause damage to DNA, but we recognize that is not the same as the ability to cause cancer. In fact many chemicals that test positive in the genotoxicity tests are not suspect of being human carcinogens at all.
So the next step is to test the chemical in whole animals.
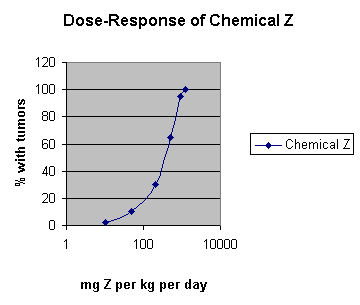
Here is the result of an animal study of the carcinogenic chemical Z. This study used 1400 rats and fed them Z each day for two years, then killed the animals and examined them for tumors. The study used 100 males and 100 female rats at each of six doses plus an unexposed control group. The study cost $1,400,000.

At the lowest dose tested, 10 mg / kg day, the study found 2% of the rats had tumors - 3 males and one female. If you are doing a risk assessment in anticipation of using chemical Z in toothpaste, what sort of risk would you be comfortable with? 1 tumor in 10,000 or 1 in 100,000? If we knew the dose of Z that produced tumors in one of 100,000 rats, we could work backwards and estimate how much Z can safely be put in toothpaste. How many rats would you need? How about 800,000, I'd guess. That would be 100,000 males and that many females in each of four groups. With some economy of scale, you might treat them for $500 each, then the testing would cost only $400,000,000.
Besides the obvious practical problem, money, space, time, and finding enough pathologists to perform necropsies on 800,000 rats, there are several theoretical problems. As you move to lower and lower doses, the curve flattens out and large changes in dose result in small changes in effect. Lower doses are inherently more difficult to measure and analyze.
 |
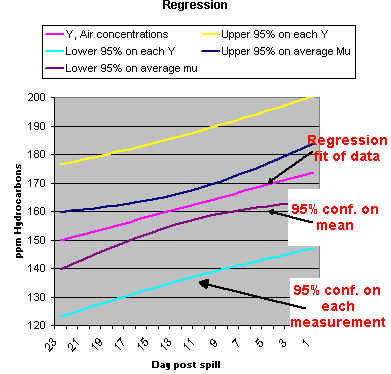
Also, from statistics, when you plot a regression line, the purple line in the graph to the left, the confidence intervals are closer, toward the center of the line, the region where you had the most data. The confidence limit flare out towards the end of the line, where you have the least data. |
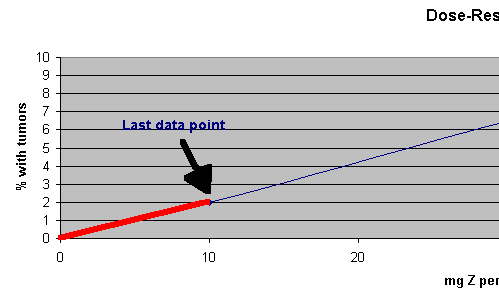
All these problems were long ago noted and except for a few very expensive tests to explore some low dose theory, no one tries to analyze in this very low dose range. The EPA and others have instead relied on extrapolations, from high to low dose. Here is the lower end of the chemical Z test:

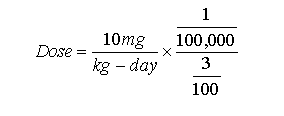
We just stretch a straight line from the lowest data point we have, 2% at 10 mg/kg-day, to 0% at 0 dose. (We converted from a log to a arithmetical axis.) From here it is easy to compute the dose that could cause a tumor in 1 out of 100,000 male rats. It would be :
 which works out to 0.0033 mg/kg-day, which is
the slope of the line for male rats.
If we wanted the dose that would cause a tumor in one out of a million, it is just 0.00033 gm/kg-day. We can calculate any risk we want. This saves rats, and is otherwise very practical. Note several things. It is based on the "no threshold theory." A chemical could reach zero effect at some much larger dose, but we are assuming it does not. Once a chemical is known to cause cancer at some high dose, it is always possible to calculate a carcinogenic effect, no mater how small the dose. Below I'll discuss a slightly more complicated model used to extrapolate for cancer, but the result is the same, we compute a slope of a line. This slope factor was given the ingenious name "slope factor."
Of course what I gave you above was too simple. You note that it really relies on just one test point, the lowest at which tumors were noted. [The following is discussed a little more in the statistics links from Submodule 5A.] The procedure that is more often used is the data points that are available, usually dose versus animals with tumors, are fit assuming the points follow a "beta distribution." The beta distribution is sound statistically, if the effect studied depends on several independent events, which we believe is the case with cancer. "Knowing" that the points in the curve are best with the beta distribution, statistician can determine the 95% confidence intervals. Then, the dose at which 10% of the animals developed tumors is determined, then the upper 95% confidence limits at that point are determined. Then a straight line scribed from that point to zero. Note, this is very different than how they sell pigs in Bavaria.
In this chemical Z example there was a difference between male and female rats. Gender differences in toxicity are common. Would we now compute the risk for male and female humans differently? As with the RfD, you need to examine the toxicology to understand the data. Typically the most sensitive species or gender is used in the evaluation, unless enough mechanistic data is available in order to make distinctions.
For the last, I've saved the most significant problem with animal testing. In order to determine if a chemical causes cancer in a reasonable amount of test animals, the animals are tested with the Maximum Tolerated Dose (MTD). Here's how it works. The young test animals of the same strain are treated with varying doses of the chemical, including doses right up to doses that are acutely toxic. The exposures are continued for three months. At the end, those animals body weight is compared with controls, and the highest test concentration that did not produce significant decrease in body weight is considered the MTD. The real tests are done with the MTD, and fractions of the MTD. Those tests are continued for just short of the life of the animals, at which time they are killed and examined for tumors.