Food Chain Transport
Human exposure via the food chain is often divided into crops and livestock. Livestock is exposed directly by the same routes as humans and via "crops" or feed. For Alaska, I would add a third category, subsistence, which include fish and game. Many lower-48 risk assessments consider "fish," as you've noted, but the implication is that the fish is recreational, thus easily avoided or minimized. The difference, in my usage, between subsistence and livestock is that the livestock are exposed under a situation where the exposure could be measure and/or controlled. Subsistence fish and game are exposed under a situation where the exposure is often difficult to measure.
Crop contamination: Soil route vs. water route
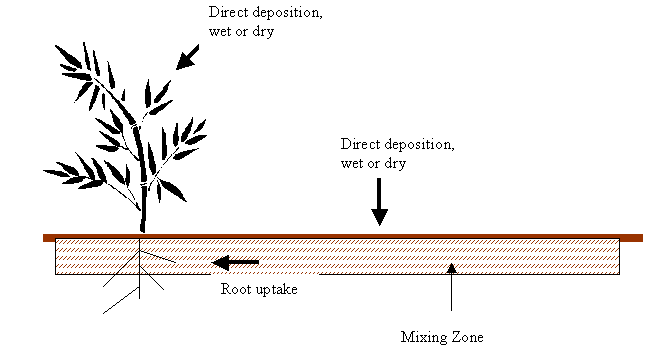
The RISC program or similar can compute contaminant concentration in ground or surface water by methods that we have discussed. Plants and soil at sites distant from the source of contamination might become contaminated by direct deposition of contaminant via the atmosphere. Either wet deposition via rain or dry deposition via dust. Soil may also be contaminated via water used for irrigation. Once soil is contaminated, the plants may become contaminated by uptake through the roots.

The rate of addition of the contaminant to the system we are observing will vary with time. Some contamination will leave via "natural attenuation." Various computer programs are available to model this process.
| Parameters (might have several) |
| Air to soil transfer |
| Soil to vegetation |
| Air to vegetation |
Livestock
Similar to the exposure factors for human, one can compute the concentration in flesh, CF, or milk, CM, from the concentration in the vegetation the animal grazes on CVeg as:
CF = CVeg*uptake*FF
Where uptake is how much the cow eats per day and FF is a factor you look up in a table. The FF is a steady state parameter and is based upon the kinetic parameters of absorption, metabolism and excretion of the contaminant by the animal. A similar factor FM is available for transfer to milk.
Subsistence animals, fish
Bioconcentration
As fish are exposed to a constant concentration of contaminant in water, the concentration of the contaminant in their flesh rises from background up to some maximum. That concentration represent the balance of the rate the fish metabolize the contaminant versus the rate at which it is absorbed. At that steady state, the bioconcentration factor KB is defined as:

Where CB is the concentration in the fish body and CW is the concentration in water.
There is a relation between the bioconcentration factor and the octanol-water partition coefficient.
log KB = log KOW - 1.32
Which is supposed to work for log KOW greater than 5 or 6. I suspect it is a good estimate. Note we are talking about "fish," macro-organisms. All vertebrate species have elaborate enzyme systems that metabolize many contaminant chemicals ("depurate," a word I never use, means the same as "eliminate" which is the sum of "metabolize" and "excrete" but is little broader and is common in environmental toxicology.) Many microorganisms also have enzyme systems, but most are different than those in vertebrate. Presumably the absorption of the contaminant by the microorganisms and elimination of the contaminate by microorganisms is in steady state and, after these organisms are filtered out of the test water, we are looking at the concentration of contaminant in the filtered water, which we then compare to that in fish. Since the bioconcentration factor is empirically derived, the uptake of contaminant is both by absorption directly from the water and via ingestion of these microorganisms. Here are some bioconcentration factors for fish:
|
Bioconcentration factor, KB , for fish
|
|
|
Chemical
|
KB
|
| Phenanthrene | 325 |
| Anthracene | 917 |
| Pyrene | 2702 |
| Hexachlorobenzene | 7880 |
| TCDD | 9270 |
| P,P'-DDT | 100,000 |
Biomagnification
Some contaminants are poorly eliminated. Many of the chlorinated solvents and pesticides are in this category. PCB's as a group (remember there are many PCB congeners) are certainly in this category. Therefore as contaminated plants and animals from lower trophic levels are consumed by predators, the concentration of PCB's in the higher trophic levels increases. Some real numbers from the Great Lakes in 1990:
| Concentration of PCBs. Biomagnified in the Aquatic Food Chain of the Great Lakes | |
| Phytoplankton | 0.0025 ppm |
| Zooplankton | 0.123 ppm |
| Rainbow Smelt | 1.04 ppm |
| Lake Trout | 4.83 ppm |
| Herring Gull Eggs | 124 ppm |
End of unit on food chain transport.