Module 9
CPM vs. PERT
Chapter 8 deals with scheduling and starts with CPM, Critical Path Method, and
PERT, Program Evaluation and Review Technique. As I learned it back in the dark
ages (punch cards) PERT used probabilistic methods and CPM used deterministic.
With the presentation in Meredith, the distinction, if there was one, evaporates.
I use the term CPM for both.
Activity on Arrow vs. Activity on Node.
General: CPM, uses two alternative methods of displaying the process, called
"activity on arrow" and "activity on node." They are equivalent.
I suggest you learn by using activity on arrow. Computer generated schedules
have trouble printing that method, so they started using use activity on node.
Start node: AoA the start node is always time zero and activities take off from there. For AoN is it often helpful to invent a start node with zero duration. MS Project will let you do that with a "milestone."
Float vs. Slack
The words "float" and "slack" are absolutely synonymous
and mean the amount of time an activity can be delayed without delaying the
project. I alternate between those terms, for no apparent reason except that
I don't remember which one I used last time.
Gantt Charts vs. Bar Charts
Your book starts with CPM/PERT, they are both powerful concepts and are useful
tools. These are the methods schedulers use to develop and analyze complex schedules.
Gantt charts, as I see them, are graphical representations of the schedulers
output, after they have developed them in CPM. Because Gantt Charts are understandable
to a non-scheduler, they are frequently used for presentations. Your book does
not mention bar charts. Bar charts are the next step in simplicity, after
Gantt charts. (Or Bar Charts are the simplest type of Gantt Charts.) While they
are not useful tools for scheduling and organizing a project, they are good
tools for making overall broad brush presentations of projects. They are understandable
without explanation to almost everyone. With a few annotations, they make good
cover pages to more complicated reports.
Free Slack vs. Total Slack
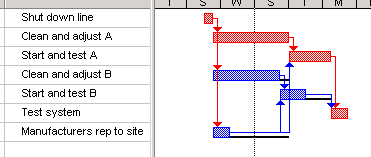
Meredith does not emphasize this, but MS Project does. "Free Slack" is the slack an activity possesses before it delays the next activity. "Total Slack" is the slack an activity possesses before it delays the project. If the total slack is greater than the free slack, then subsequent activities must have some slack in them. For example in Manufacturers rep to site, there is 3 days of free slack and 5 days of total slack.

Section 8.4
Section 8.4, Extensions and Applications. You should read this section, but
its "not on your final exam." But I want you to be aware of what I
call "flow charting." As a young engineer I was confident that I could
figure just about anything out, and if I couldn't, "...let's get started,
we'll cross that bridge when we come to it." Today I am older and more
cautions, having found the bridge was sometimes not there, when we came to the
river. As a result, I started using flow charts to diagram the choices I would
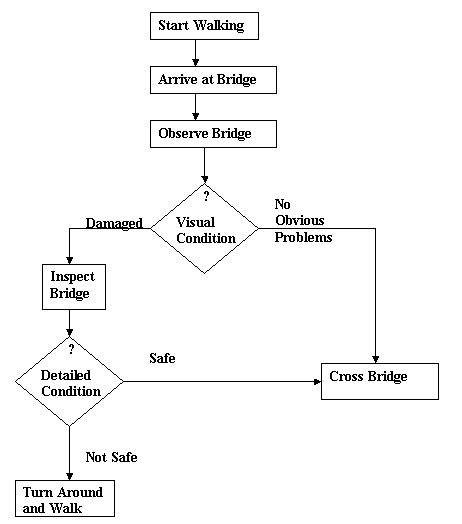
be making (or fate would present to me) and what we might do next. Here is a
flow chart of some possibilities, the diamonds indicate a decision point.

Now after I develop the flow chart, I could assign probabilities to each of the options, for example, the probability that bridge would be damaged, based on the visual condition. Often projects have many such decision points, and all the scheduling after that point must be predicated on the result of those decision points. From the flow chart with probability, you could develop GERT charts, but you are probably leaving elementary project management and getting to material taught in courses such as: Advance Project Management, Operations Research, or Management Decisions Under Uncertainly.
Note from here on, there is problem-solving homework. Whenever possible do these in Project. Next, use Excel, and Lastly Word. But, in Excel, pay careful attention to labeling.
From here out you often need to send me several documents in the homework. Please package the problems label them according to the below.
Notes on MS Project:
For these chapters, you will work mostly with two views : Gantt Chart and Network Diagram, and two tables: entry and schedule, and two reports: Overview - Project Summary and Critical Tasks. You will also need the PERT Analysis Toolbar. You can get the views from the menu on the left side of the screen. The others you get to from the VIEW pull down menu at the top. After you have done the tutorial, which you did last week - right? - I suggest you play with those 7 items and see what is there.
Your book, probably for typesetting reasons, presents most of the scheduling problems as lists of tasks or activities such as "AB," "AC," etc. Which means the activity between nodes (or events) A and B, and A and C, etc. The first step I take is number the activities, starting with one. Then I lay out an activity-on-arrow diagram of the entire operation, using the letters in each node. You need to do this, in order to determine the precedence of the activities. Then I label the arrows with the number corresponding to that activity. You need to do this because in MS Project the precedences are the number of the events, not their name. Having done that, you scope the problem and your output. If you need an Excel spreadsheet, you can input all you data to Excel, then copy and paste the columns of data to Project. Often you will need Project to determine the critical path, and Excel to calculate costs.
You need to show the critical path on the Gantt charts, you can do this by using the "Wizard" or changing the view then more views then Detailed Gantt.
For the Material Review Questions 6, 7, and 11, Discussion Question 19, and Problem 3 send a Word document, name the file per usual HW9_name.
For Problems 8, 21 and 22 send a Microsoft Project file labeled HW9_8_name, HW9_21_name, and HW9_22_name.
For Problem 27 send a Microsoft Poject file labeled HW9_27_name and an Excel spreadsheet labeled HW9Excel_name for the probabilistic analysis.