Uncertainty in the science
In the previous sub-module we examined statistics that help describe uncertainty in our data. Here we consider uncertainty in general.
The primary sources of uncertainty are variability and data gaps. Variability arises from systematic or random errors in measurements or inherent variability in the extent of exposures. Data gaps mean we do not have data and must make approximations regarding exposure, chemical fate, intakes and toxicity. For example, we know for the average adult how much water they drink each day, and what the standard deviation of that intake is. We do not know how much water Charlie drinks. We can estimate that, based on the averages, but do not know what any particular person will drink next year. It is important to know that for uncertainty due to variably, we may not be able to reduce the uncertainty no matter how much work we do. Data gaps may be improved.
Go to the Understanding RISK Analysis document you met back in Module 1 and read Sources of Evidence for Health Risk Assessments, pp 20-28 (19-27 as Adobe counts pages). Bookmark this for your homework.
Here is an EPA document with a short chapter on uncertainty in exposure assessments. Chapter 2 has a relatively short, but thorough, discussion of the basics. You will note means and SDs given as well as qualitative descriptions of uncertainties.
(Optional) Read the pages 206 to 211 (pdf page) from RAGS, Chapter 8.4, for an overview of uncertainties.
For the uncertainties in toxicology, we have both expected variably in our receptor population and data gaps on our knowledge. Even with good laboratory data on the toxicity to laboratory animals, we will always have two big sources of uncertainty, frequently called extrapolations. The first is an extrapolation.

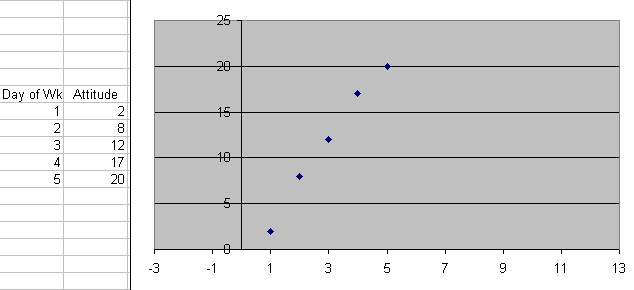
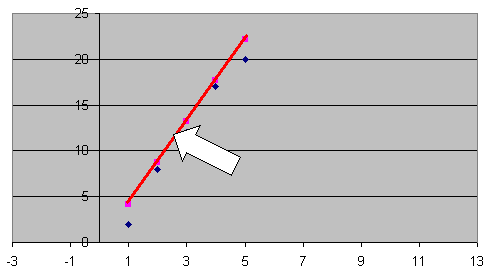
Here we have measured the attitude of a college student each morning at 8 AM , Day 1 is Monday and so on. Next we use a linear regression program to find a line that is the best fit of those data points. Now if we want to estimate the student's attitude for 8 PM on Tuesday, we use Day 2.5 as the independent variable and locate the corresponding attitude as 12. This is an example of interpolating between data points. Do you think this particular interpolation will give you an adequate estimate of the student attitude at 8 PM

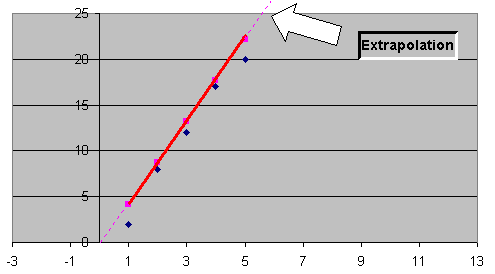
Scientists and engineers use interpolations every day. An extrapolation, on the other hand, is an extension of the data beyond its range.

We might use an extrapolation of the data to estimate the student's attitude on Saturday night. The extrapolation would indicate the attitude would be around 25, the best attitude all week. Of course the student might be studying that weekend and have a poor attitude on Saturday night. Or we might extend the extrapolation to day 8, the Monday of the following week and estimate that the students attitude would be far better than last Monday.
While estimating attitude seems unscientific, that is because we intuitively realize that the attitude is the product of complex processes that are not obvious to the observer. Unfortunately this is also true with much toxicology. While the dose might be measured to the microgram and the response, especially if its something simple like death, can be observed very accurately, what we are observing is in fact the summation of the reactions of hundreds of biochemical process, most linked together with various feed back control loops. It is easy to scribe a straight line and extrapolate, but the predictions based on it are guesses, not verified fact.