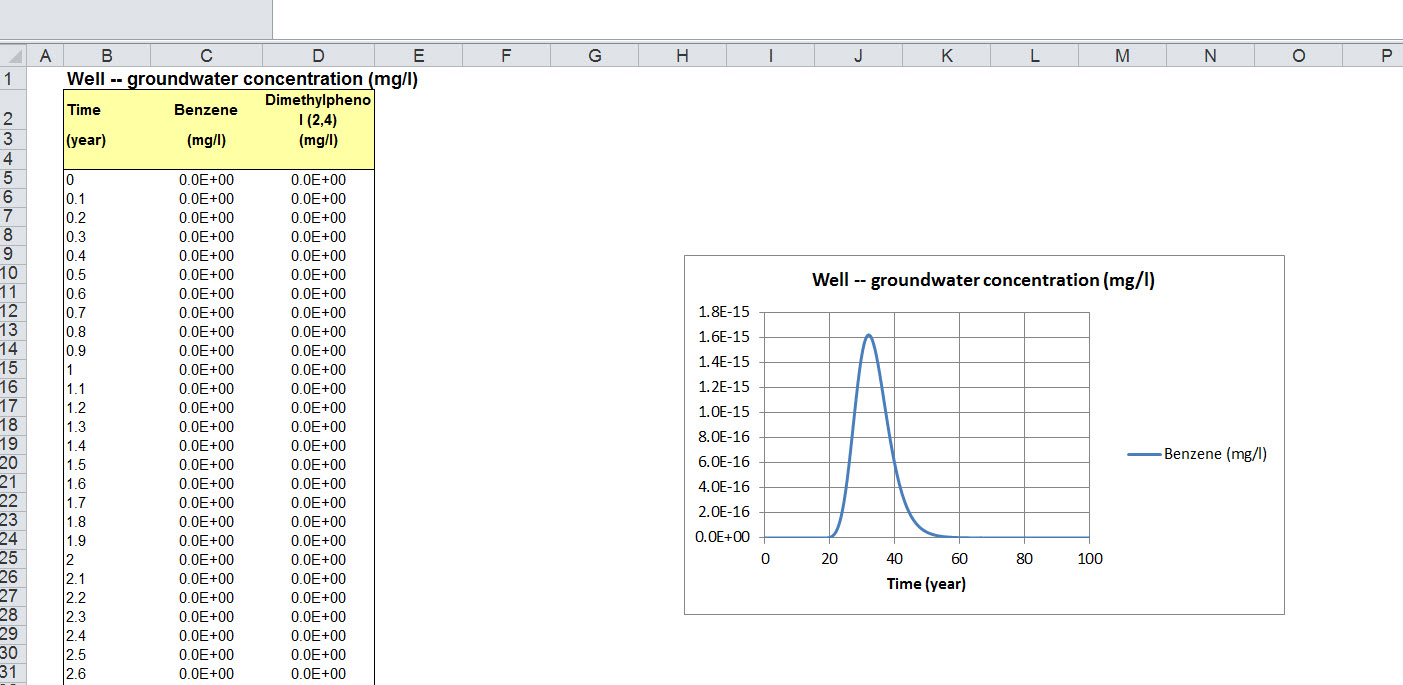
Here is a file on a contaminated site. File. Right click and use "Save target as" to save the file. It will be easier to make a new folder on your C drive (not your desktop), I called it RISC 2013, and save the file to there. Use a short folder name, since only the first letters will be visible. Open RISC and use RISC to open this file. It has an analysis of two chemicals spilled to the soil that may migrate through the groundwater and contaminate a downgradient well. The file has all the data entered to bring you all the way through Step 3. [REMEMBER to click that check "OK" in the upper left hand side each time to move, back or ahead.}Click on Step 3, Click on all the steps, a, b, c, and d, and then click OK again, you will see a check mark by the box. Then on Step 3d, click on start simulation, then on finished, and finally on view results, and you will get an Excel file open, although it may take a while, and also a menu, click on the well model and then on Benzene, then after a while you will see the graph for benzene.
Then do the same for the other chemical and see how much longer it takes that to peak. Note you should be able to see both chemicals on the same chart, but I did not have much luck with that because of scaling one is a flat line on the axis - although one could see both chemicals in the tabular data.
Now click on OK a few times, when you see the screen with the six steps. Click on Step 1 and add your favorite chemical to the list. Choose a favorite with a log Kow between 2 and 3 [I used one with Kow of 1.48 and got readable results. Then click on through the program, you'll need to enter the point concentration in Step 3b and click the simulation in Step 3c. You can see graphs for the three chemicals on the view at step 3d.
. If you don't see yours,
try selecting a chemical with a smaller Kow and/or increasing its concentration.
For homework:
1. After you get all three chemicals on the same graph, one is zero, the other
two are visible, save the file with the first 4 letters of your name, followed
by 1.
2. Now start from the beginning and deselect my two chemicals, so you are only
working with yours.
3. Go back and vary the parameters in Step 3a. Click on the green checks and
look at the values of the parameters. Vary the hydraulic gradient and re-simulate
and observe how the concentration of the chemical in the well varies. Then do
the same for the Soil type. Try gravel. Note how the porosity changes. Finally,
enter or vary a degradation rate. What happens to the concentrations?
4. In the characteristic of the unsaturated zone, change the "infiltration
rate." This is usually the annual rainfall. What happens?
5. Vary the well location.
Send me two files:. One, the file you saved with your chemical and its concentration in the well visible. Two, a Word document, two paragraphs long. Describe what happens to your chemical as you vary those parameters. If time and money were limited, which of those parameters do you think would be most worthwhile to spend your efforts evaluating further?