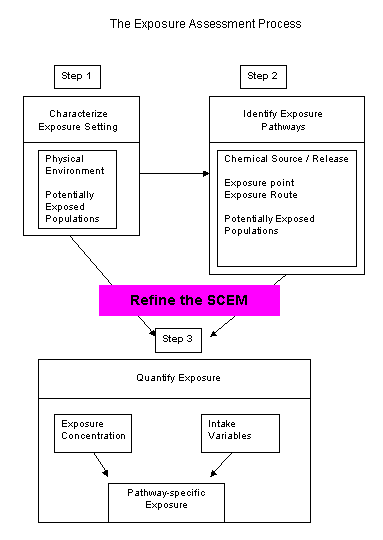
We now start a more detailed analysis than the DoE site. Here is overview diagram of Exposure Assessment:

The final output, pathway-specific exposure, will be combined with dose-response relation to state the probability of some adverse health effect to some class of receptors from a particular pathway. For example, the increase in risk of cancer to adults in the Elmtree subdivision due to TCE in the drinking water is XXX. For the adults in the Elmtree subdivision, you might also consider the increase in cancer risk from showering with the TCE contaminated water. You would do an exposure assessment of both the drinking water pathway and the shower water pathway.
You summarize your work on the first two steps with a Site Conceptual Exposure Model (SCEM). Perhaps more important, developing a SCEM helps you organize your work. Now for any given site or situation, you have probably developed a "back of the envelope" SCEM as soon as you learn of the site. What chemicals have been released, where are they going, who is endangered? You probably had to answer those questions in order to get budget to go any further. The sketch you saw at the DoE site is called a graphical conceptual site model. It probably indicates your knowledge at this point.